
Publisher:
Bonnie King
CONTACT:
Newsroom@Salem-news.com
Advertising:
Adsales@Salem-news.com

~Truth~
~Justice~
~Peace~
TJP
Dec-13-2010 21:08

 TweetFollow @OregonNews
Salem Real Estate News and Trends
Salem-News.comIn Salem, 15.8 percent, or 10,712, of all residential properties with a mortgage were in negative equity for third quarter 2010.
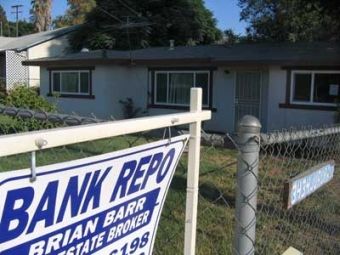 File photo courtesy: The Press-Enterprise |
(SANTA ANA, Calif.) - CoreLogic (NYSE: CLGX) today released negative equity data indicating a third consecutive quarterly decline in negative equity for residential properties. CoreLogic reports that 10.8 million, or 22.5 percent, of all residential properties with mortgages were in negative equity at the end of the third quarter of 2010, down from 11.0 million and 23 percent in the second quarter. This is due primarily to foreclosures of severely negative equity properties rather than an increase in home values.
During this year the number of borrowers in negative equity has declined by over 500,000 borrowers. An additional 2.4 million borrowers had less than five percent equity in the third quarter. Together, negative equity and near-negative equity mortgages accounted for 27.5 percent of all residential properties with a mortgage nationwide.
Negative equity, often referred to as "underwater" or "upside down," means that borrowers owe more on their mortgages than their homes are worth. Negative equity can occur because of a decline in value, an increase in mortgage debt or a combination of both.
In Salem, 15.8 percent, or 10,712, of all residential properties with a mortgage were in negative equity for third quarter 2010. An additional 6.6 percent, or 4,512, were in near negative equity in Salem.
National Data Highlights
- Negative equity remains concentrated in five states: Nevada, which had the highest negative equity percentage with 67 percent of all of its mortgaged properties underwater, followed by Arizona (49 percent), Florida (46 percent), Michigan (38 percent) and California (32 percent).
- The largest declines in negative equity were concentrated in the hardest hit states. Alaska experienced the largest decline, falling 1.8 percentage points, followed by Nevada (-1.6), Arizona (-1.4), California (-1.2), and Florida (-0.9). Idaho and Alabama are the only states with noticeable increases, which is not a surprise given they are currently the two top states for home price depreciation.
- Although the level of negative equity is very high, there are still many homeowners with equity (Figure 4). Nearly half of New York borrowers have 50 percent or more positive equity, which leads the nation, followed by Hawaii (43 percent), Massachusetts (40 percent), Connecticut (39 percent) and Rhode Island (40 percent). There are some states that have barbell distributions of somewhat higher negative equity shares and higher percentages of borrowers with 50 percent or more positive equity. Rhode Island is the most extreme example as it ranks in the top 15 for both negative equity and for states with the highest share of 50 percent or more positive equity. To a lesser degree Massachusetts, New Jersey, Washington, D.C. and California exhibit similar trends.
- According to the Census, the Q3 2010 homeownership rate was 66.9 percent, down from a peak of 69.2 percent in Q4 2004. The Census definition of homeownership includes homeowners in negative equity. However, homeowners in negative equity are not likely to behave similarly to homeowners with equity, because their financial interest (the equity) has disappeared and has only a small prospect of returning soon given price trends. The lack of equity means upside down homeowners are not likely to maintain and improve their property and are more likely to behave like renters.
- An alternative definition of homeownership is to exclude owners with negative equity, which nets the effective homeownership rate (Figure 5). Adjusting for severe negative equity of 25 percent or more reveals that the effective homeownership rate as of Q3 was 62.4 percent or 4.5 percentage points lower than the official rate. Removing all negative equity homeowners reveals an effective homeownership rate of 56.6 percent or over 10 percentage points lower than the official rate.
- At low shares of negative equity, the pre-foreclosure rate is higher for borrowers with more expensive homes (above $500,000) than for borrowers with low to moderately priced homes (between $100,000 and $300,000). Interestingly, once in deep negative equity, the relationship reverses with the low to moderately priced homes exhibiting fairly higher pre-foreclosure rates (Figure 6).
- The aggregate level of negative equity declined to $744 billion, which is a three-percent decline from Q2 2010 and a seven-percent decline from the end of 2009 when it stood at $800 billion.
"Negative equity is a primary factor holding back the housing market and broader economy. The good news is that negative equity is slowly declining, but the bad news is that price declines are accelerating, which may put a stop to or reverse the recent improvement in negative equity," said Mark Fleming, chief economist with CoreLogic.


Methodology:
CoreLogic data includes 48 million properties with a mortgage, which accounts for over 85 percent of all mortgages in the U.S.** CoreLogic used its public record data as the source of the mortgage debt outstanding (MDO) and it includes first mortgage liens and junior mortgage liens and is adjusted for amortization and home equity utilization in order to capture the true level of mortgage debt outstanding for each property. The current value was estimated by using the CoreLogic Automated Valuation Models (AVM) for residential properties. The data was filtered to include only properties valued between $30,000 and $30 million because AVM accuracy tends to quickly worsen outside of this value range.
The amount of equity for each property was determined by subtracting the property’s estimated current value from the mortgage debt outstanding. If the mortgage debt was greater than the estimated value, then the property is in a negative equity position. The data was created at the property level and aggregated to higher levels of geography.
** Only data for mortgaged residential properties that have an AVM value is presented. There are several states where the public record, AVM or mortgage coverage is thin. Although coverage is thin, these states account for fewer than 5 percent of the total population of the U.S.
Articles for December 12, 2010 | Articles for December 13, 2010 | Articles for December 14, 2010

googlec507860f6901db00.html
Quick Links
DINING
Willamette UniversityGoudy Commons Cafe
Dine on the Queen
Willamette Queen Sternwheeler
MUST SEE SALEM
Oregon Capitol ToursCapitol History Gateway
Willamette River Ride
Willamette Queen Sternwheeler
Historic Home Tours:
Deepwood Museum
The Bush House
Gaiety Hollow Garden
AUCTIONS - APPRAISALS
Auction Masters & AppraisalsCONSTRUCTION SERVICES
Roofing and ContractingSheridan, Ore.
ONLINE SHOPPING
Special Occasion DressesAdvertise with Salem-News
Contact:AdSales@Salem-News.com


Terms of Service | Privacy Policy
All comments and messages are approved by people and self promotional links or unacceptable comments are denied.
[Return to Top]
©2026 Salem-News.com. All opinions expressed in this article are those of the author and do not necessarily reflect those of Salem-News.com.