
Publisher:
Bonnie King
CONTACT:
Newsroom@Salem-news.com
Advertising:
Adsales@Salem-news.com

~Truth~
~Justice~
~Peace~
TJP
Feb-08-2012 13:35

 TweetFollow @OregonNews
Oregon Economic and Revenue Forecast Summary
Salem-News.comSlow growth will continue to be the norm.
 Aerial view of Oregon's state capitol by Tim King Salem-News.com |
(SALEM) - This is the Executive Summary for the March 2012 Oregon Economic Forecast. Salem-News.com brings you the complete document, and also reactions to the news of Oregon falling more than $35 million this year.
This information contains recent trends, demographics, risks and forecasts, General Fund revenues and information on Extended General Fund revenue outlook.
Current Conditions
The recent performance of Oregon’s economy has been encouraging. Although the pace of job creation remains glacial, improvements have been broad-based across a wide range of industries and occupations.
Growth remains slow in the aftermath of the housing crisis since households are spending cautiously, banks are lending cautiously and businesses are investing cautiously. Despite being frustratingly slow, Oregon’s recovery is playing out according to script so far, led by gains in business investment and exports. Weakness persists in the public sector and across many housing-related industries, including wood product firms.
Although Oregon’s economy is recovering, it has not recovered. A considerable amount of talent and productive capacity are sitting idle. The number of workers suffering from long-term unemployment, which is defined as a span of more than a month or two, remains far higher than anything we have seen since the Great Depression. This is true both in Oregon and in most other U.S. states. As our resources sit idle they become less competitive, and the damage done by the recession becomes more permanent. The problem of long-term unemployment is most severe across much of rural Oregon, where many communities have yet to share in the recovery.
 |
Outlook
The baseline employment forecast remains essentially unchanged over the last six months. Slow growth will continue to be the norm. Oregon is not expected to recover all of the jobs it has lost until the end of 2014—seven years after the recession began.
The flow of positive economic news continues to gather momentum and provide hope for a better 2012. In particular, a growing chorus of job market indicators suggests that Oregon’s employment is heading in the right direction, albeit at a slow pace.
Filings for jobless claims have dropped to normal levels. Hiring plans have improved among small and large businesses alike. Manufacturers are stretching their current workforces thin, and will need to hire before they produce more.
Household expectations are becoming rosier as well. For the first time since the onset of recession, more households expect their income to rise than to fall next year.
Virtually all of the tea leaves used to predict the direction of the local economy are looking up. Although, very few signs point to strong growth, almost everything points to positive growth.
Risks
Although all signs point to Oregon’s economic expansion becoming a more self-sustaining one, the recovery is extremely fragile, with the risk of a return to recession remaining uncomfortably high.
The primary risk on economists’ radar is the sovereign debt crisis in Europe and the potential for financial contagion. Credit is the lifeblood of economic activity, and many fear a replay of the 2007 crisis when financial institutions refused to lend to each other due to uncertainty about who would be in business the next day.
There is widespread concern that the response by European policymakers to their troubles has been lacking. Even so, most forecasters now feel that the U.S. domestic recovery is now on more solid ground than it was a few weeks ago, with a global financial crisis less likely to unfold.
Recent Trends
Following a strong end to 2010 and early 2011, employment in Oregon has largely been unchanged for three quarters. There were 20,000 (1.25%) more jobs in the fourth quarter than there were a year ago. However only 4,000 of this increase occurred during the last three quarters of the year. The employment weakness during the summer could largely be explained as public sector cuts offsetting private sector gains. The same cannot be said for weakness at the end of the year, as nearly all sectors’ employment held steady – neither adding not cutting a significant number of jobs.
Note: The 2011 employment data is preliminary and the annually revised data (benchmark) covering the October 2010 through June 2011 period will be released February 28th, 2012 by the Oregon Employment Department. Our office’s expectations are the benchmark to be down which will result in a decrease in the estimated level of employment in 2011 (not to be confused with actual job losses). However, the general pattern of employment growth will remain intact. After a rocky start in the first quarter of 2010, the private sector has continued to add jobs through the end of 2011 for a total increase of nearly 38,000 or 2.9 percent.
Over the past year (2010q4 – 2011q4), private sector firms have seen sizable job gains in following industries: Construction, Information, Professional and Technical Services, Educational Services, Health Care and Social Assistance and Leisure and Hospitality. More modest employment gains were seen in Durable Goods Manufacturing, Retail Trade, Financial Activities, Administrative and Waste Services and Other Services. The only private industries to experience job losses over the year were Natural Resources, Nondurable Goods Manufacturing, Wholesale Trade and Transportation, Warehousing and Utilities. Unlike in the private sector, no improvement has been seen in government hiring, which has declined more than 2 percent in the past year.
A growing chorus of economic indicators suggests that Oregon’s job market is heading in the right direction. Fewer Oregonians are losing jobs, evidenced by lower levels of initial claims for unemployment insurance. Surveys suggest hiring plans have improved for small and large businesses alike. Manufacturers are stretching their current workforces thin, and will need to hire before they produce more. Average weekly hours worked among manufacturing workers have risen sharply to 41 hours per week in December, which was their peak during the last expansion. Household expectations are also becoming rosier as more individuals are expecting their income to rise than to fall in 2012, marking the first time this has occurred since the onset of recession.
Even with the majority of the economic data and news being positive, the forecast for economic growth – chiefly income and jobs – remains largely unchanged relative to recent forecasts. Substantial risks, concentrated to the downside, remain outstanding and may derail the fragile recovery.
Even avoiding these downside risks, the rate of growth is still expected to remain average to slightly below average. OEA forecasts an employment increase of 1.1 percent in the first quarter of 2012 and 1.9 percent in the second quarter. Job gains will remain subdued in 2012, improving at a 1.1 percent pace overall, following 1.5 percent gains in 2011. The rate of growth will pick up in 2013 at 2.4 percent and 2014 at 2.6 percent however even these rates of growth are only slightly above Oregon’s long-run employment average of 2.2 percent.
Demographic Forecast
Oregon’s population count on April 1, 2010 was 3,831,074. Oregon gained 409,550 persons between the years 2000 and 2010. The population growth during the decade of 2000 and 2010 was There is widespread concern that the response by European policymakers to their troubles has been lacking. Even so, most forecasters now feel that the U.S. domestic recovery is now on more solid ground than it was a few weeks ago, with a global financial crisis less likely to unfold.
Recent Trends
Following a strong end to 2010 and early 2011, employment in Oregon has largely been unchanged for three quarters. There were 20,000 (1.25%) more jobs in the fourth quarter than there were a year ago. However only 4,000 of this increase occurred during the last three quarters of the year. The employment weakness during the summer could largely be explained as public sector cuts offsetting private sector gains. The same cannot be said for weakness at the end of the year, as nearly all sectors’ employment held steady – neither adding not cutting a significant number of jobs.
Note: The 2011 employment data is preliminary and the annually revised data (benchmark) covering the October 2010 through June 2011 period will be released February 28th, 2012 by the Oregon Employment Department. Our office’s expectations are the benchmark to be down which will result in a decrease in the estimated level of employment in 2011 (not to be confused with actual job losses). However, the general pattern of employment growth will remain intact. After a rocky start in the first quarter of 2010, the private sector has continued to add jobs through the end of 2011 for a total increase of nearly 38,000 or 2.9 percent. Over the past year (2010q4 – 2011q4), private sector firms have seen sizable job gains in following industries: Construction, Information, Professional and Technical Services, Educational Services, Health Care and Social Assistance and Leisure and Hospitality. More modest employment gains were seen in Durable Goods Manufacturing, Retail Trade, Financial Activities, Administrative and Waste Services and Other Services. The only private industries to experience job losses over the year were Natural Resources, Nondurable Goods Manufacturing, Wholesale Trade and Transportation, Warehousing and Utilities. Unlike in the private sector, no improvement has been seen in government hiring, which has declined more than 2 percent in the past year.
A growing chorus of economic indicators suggests that Oregon’s job market is heading in the right direction. Fewer Oregonians are losing jobs, evidenced by lower levels of initial claims for unemployment insurance. Surveys suggest hiring plans have improved for small and large businesses alike. Manufacturers are stretching their current workforces thin, and will need to hire before they produce more. Average weekly hours worked among manufacturing workers have risen sharply to 41 hours per week in December, which was their peak during the last expansion. Household expectations are also becoming rosier as more individuals are expecting their income to rise than to fall in 2012, marking the first time this has occurred since the onset of recession.
Even with the majority of the economic data and news being positive, the forecast for economic growth – chiefly income and jobs – remains largely unchanged relative to recent forecasts. Substantial risks, concentrated to the downside, remain outstanding and may derail the fragile recovery. Even avoiding these downside risks, the rate of growth is still expected to remain average to slightly below average.
OEA forecasts an employment increase of 1.1 percent in the first quarter of 2012 and 1.9 percent in the second quarter. Job gains will remain subdued in 2012, improving at a 1.1 percent pace overall, following 1.5 percent gains in 2011. The rate of growth will pick up in 2013 at 2.4 percent and 2014 at 2.6 percent however even these rates of growth are only slightly above Oregon’s long-run employment average of 2.2 percent.
Demographic Forecast
Oregon’s population count on April 1, 2010 was 3,831,074. Oregon gained 409,550 persons between the years 2000 and 2010. The population growth during the decade of 2000 and 2010 was 12.0 percent, down from 20.4 percent growth from the previous decade. Oregon’s rankings in terms of decennial growth rate dropped from 11th between 1990-2000 to 18th between 2000-2010. Slow population growth during the most recent decade due to double recessions probably cost Oregon one additional seat in the U.S. House of Representatives. Actually, Oregon’s decennial population growth rate during the most recent decade was the second lowest since 1900. The slowest was during the 1980 when Oregon was hit hard by another recession. As a result of recent economic downturn and sluggish recovery, Oregon’s population is expected to continue a slow pace of growth in the near future. Based on the current forecast, Oregon’s population will reach 4.27 million in the year 2020 with an annual rate of growth of 1.1 percent between 2010 and 2020. Oregon’s economic condition heavily influences the state’s population growth. Its economy determines the ability to retain local work force as well as attract job seekers from national and international labor market. As Oregon’s total fertility rate remains below the replacement level and deaths continue to rise due to ageing population, long-term growth comes mainly from net in-migration. Working-age adults come to Oregon as long as we have favorable economic and employment environments. During the 1980s, which included a major recession and a net loss of population, net migration contributed to 22 percent of the population change. On the other extreme, net migration accounted for 73 percent of the population change during the booming economy of 1990s. This share of migration to population change declined to 56 percent in 2002 and it was further down to 32 percent in 2010. As a sign of slow to modest economic gain, the ratio of net migration-to-population change will increase gradually and will reach 70 percent by the end of the forecast horizon. Although economy and employment situation in Oregon look stagnant at this time, migration situation is not expected to replicate the early 1980s pattern of negative net migration. Potential Oregon out-migrants have no better place to go since other states are also in the same boat in terms of economy and employment.
Age structure and its change affect employment, state revenue, and expenditure. Demographics are the major budget drivers, which are modified by policy choices on service delivery. Growth in many age groups will show the effects of the baby-boom and their echo generations during the period of 2010-2020. It will also reflect demographics impacted by the depression era birth cohort combined with diminished migration of the working age population and elderly retirees. After a period of slow growth during the 1990s and early 2000s, the elderly population (65+) has picked up a faster pace of growth and will surge as the baby-boom generation continue to enter this age group. The average annual growth of the elderly population will be 3.9 percent during the forecast period as the boomers continue to enter retirement age. However, the youngest elderly (aged 65-74) will grow at an extremely fast pace during the forecast period, averaging 4.9 percent annual rate of growth due to the direct impact of the baby-boom generation entering retirement age. Reversing several years of shrinking population, the elderly aged 75-84 will start a positive growth as the effect of depression era birth-cohort will dissipate. A faster pace of growth of population in this age group will begin once the baby-boom generation starts to mature. The oldest elderly (aged 85+) will continue to grow at a moderately but steady rate due to the combination of cohort change, continued positive net migration, and improving longevity. The average annual rate of growth for this oldest elderly over the forecast horizon will be 1.6 percent,
As the baby-boom generation matures out of oldest working-age cohort combined with slowing net migration, the once fast-paced growth of population aged 45-64 will gradually taper off to below zero percent rate by 2012 and will remain at slow or below zero growth phase for several years. The size of this older working-age population will decline during the forecast horizon of 2010-2020. The 25-44 age group population is recovering from several years of declining and slow growing trend. The decline was mainly due to the exiting baby-boom cohort. This age group has seen positive growth starting in the year 2004 and will increase by 1.1 percent annual average rate during the forecast horizon. The young adult population (aged 18-24) will change only a little over the forecast period and remain virtually unchanged for most of the years into the future. Although the slow or stagnant growth of college-age population (age 18-24), in general, tend to ease the pressure on public spending on higher education, college enrollment typically goes up during the time of high unemployment and scarcity of well-paying jobs when even the older people flock back to college to better position themselves in a tough job market. The growth in K-12 population (aged 5-17) will remain low which will translate into slow growth in school enrollments. This school-age population has actually declined in size in recent years and will grow in the future at well below the state average. The growth rate for children under the age of five will remain below zero percent in the near future and will see positive growth only after 2013. Although the number of children under the age of five will decline slightly in the near future, the demand for child care services and pre-Kindergarten program will be additionally determined by the labor force participation and poverty rates of the parents. Overall, elderly population over age 65 will increase rapidly whereas population groups under age 65 will experience slow growth in the coming decade. Hence, based solely on demographics of Oregon, demand for public services geared towards children and young adults will likely to increase at a slower pace, whereas demand for elderly care and services will increase rapidly.
Revenue Forecast
Similar to the outlook for economic growth, the near-term revenue forecast has stabilized in recent months. Expectations call for slow growth over the next two fiscal years. Growth in personal income tax collections is expected to moderate, but remain strong enough to offset losses in corporate income tax collections and flat lottery transfers.
Since the December forecast, combined general fund and lottery resources have been revised lower by $35.1 million for the 2011-13 biennium, and lower by $15.8 million for the 2013-15 biennium.
Most of the reduction in the near-term revenue forecast can be traced to personal income tax returns from 2010 that were submitted by filers who requested extensions. Such filers include many high-income households with complicated tax returns. On average, filers who take advantage of extensions tend to pay more than they owe in April in order to avoid late payment penalties. Last April, such filers overshot their tax liability by an unusually large amount, and drained state coffers when they asked for it back in the fall.
Encouragingly, 2010 personal income tax returns have now been largely processed, and cannot do any further damage to collections. Excluding 2010 tax reconciliations, fiscal year 2012 has started off well, with the vast majority of revenue line items tracking above the forecast. In particular, withholdings out of wages and salaries have held up surprisingly well in recent weeks. However, given Oregon’s dependence on personal income taxes, the 2012 outlook for collections will remain highly uncertain until the April tax season passes.
During fiscal year 2011, personal income tax collections grew at a 12% rate, which was more than double the growth seen in underlying personal income. Heading into 2012, many of the factors supporting Oregon’s strong personal income tax revenue gains will go away. As a result, revenue growth is expected to be cut in half in the months ahead. Income tax collections are expected to increase by roughly $600 million over fiscal years 2012 and 2013, matching the growth seen in fiscal year 2011 alone.
Such a slowdown in collections has been assumed in the outlook for several months. The current outlook is only marginally more pessimistic than was the December forecast. However, the risks to the outlook remain skewed to the downside. If the U.S. economy slips back into recession, it would certainly drag Oregon’s regional economy and state tax revenues down with it. In such a scenario, the forecast for tax revenues would fall on the order of $1 billion for the current biennium.
After the smoke clears, revenue growth in Oregon and other states will face considerable downward pressure over the 10-year extended forecast horizon. As the baby boom population cohort works less and spends less, traditional state tax instruments such as personal income taxes and general sales taxes will become less effective, and revenue growth will fail to match the pace seen during recent periods of economic expansion.
A. 2011-13 General Fund Revenues
Led by personal income tax collections, general fund revenues have expanded at their long-run average pace through the first seven months of fiscal year 2012. Corporate tax collections are now falling rapidly, with the boom in underlying corporate profits having come to an end. Lottery sales have grown at only a snail’s pace since the recession began.
Growth in collections will lose steam over the remainder of the biennium. Many of the factors supporting Oregon’s strong revenue gains in fiscal year 2011 are now going away. Growth in personal income taxes will face downward pressure from policy changes, including revisions to the tax withholding tables in 2011 and a reduced 2012 income tax rate on high-income filers. Moreover, the declines in stock prices and business income seen at the end of the summer will lead to less growth in taxable capital gains and bonuses this year. Also, households have depended on a wide range of alternative taxable income sources in recent years to help replace lost labor income. Some of these sources, including unemployment insurance payments and tax-deferred savings accounts such as IRAs, have been heavily tapped, and will weaken going forward.
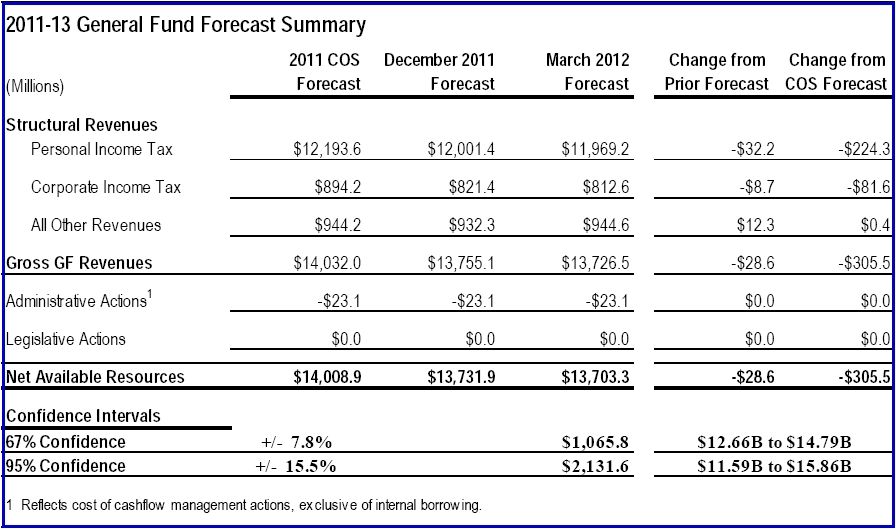
Largely due to reconciliations of 2010 tax returns, expected revenues for the 2011-13 biennium are somewhat weaker than what was predicted in the December 2011 forecast. The forecast for General Fund revenues for 2011-13 is now $13,703 million. This represents a decrease of $28.63 million (-0.2%) from the December 2011 forecast.
Table R.1
 |
Personal Income Tax
Personal income tax collections were $1,403 million for the second quarter of fiscal year 2012, $35.3 million (2.5%) below the latest forecast. Compared to the year-ago level, total personal income tax collections were up 10.1% relative to a forecast of 12.8% growth. Table B.8 in Appendix B presents a comparison of actual and projected personal income tax revenues for the second quarter of fiscal year 2012.
Although personal income tax collections tied to current economic conditions remain healthy, the forecast for total personal income tax receipts during the current biennium was reduced by $32 million from the December forecast. This revision can largely be traced to disappointing reconciliations of 2010 tax returns.
Corporate Taxes
Corporate excise taxes equaled $90 million for the second quarter of fiscal year 2012, $0.9 million above the December forecast. Compared to the year-ago level, total corporate receipts were down 15.9% relative to a forecast of a 16.8% decline. Table B.8 in Appendix B presents a comparison of actual and projected corporate income tax revenues for the fourth quarter of fiscal year 2011. Corporate profits, and associated tax collections, are cooling off rapidly after reaching record highs. Profits and corporate tax collections are notoriously volatile, with collections often cut in half in the year immediately following profit booms. The expectation for a sharp correction in corporate income tax collections over the coming year has been built into recent forecasts. The December outlook for 2011-13 was revised downward by $8.7 million (1.1%).
Non-income Tax Sources of Revenue
All other revenues will total $944 million for the biennium, an increase of $12.3 million (1.3%) from the prior forecast. Most small revenue line items are now performing better than expectations. Revisions were largest for state court fees and criminal fines, where the impacts of 2009-11 legislation are now appearing in the revenue data.
B. Extended General Fund Revenue Outlook
Table R.2 exhibits the long-run forecast for General Fund revenues through the 2019-21 biennium. Users should note that the potential for error in the forecast increases substantially the further ahead we look.
Table R.2
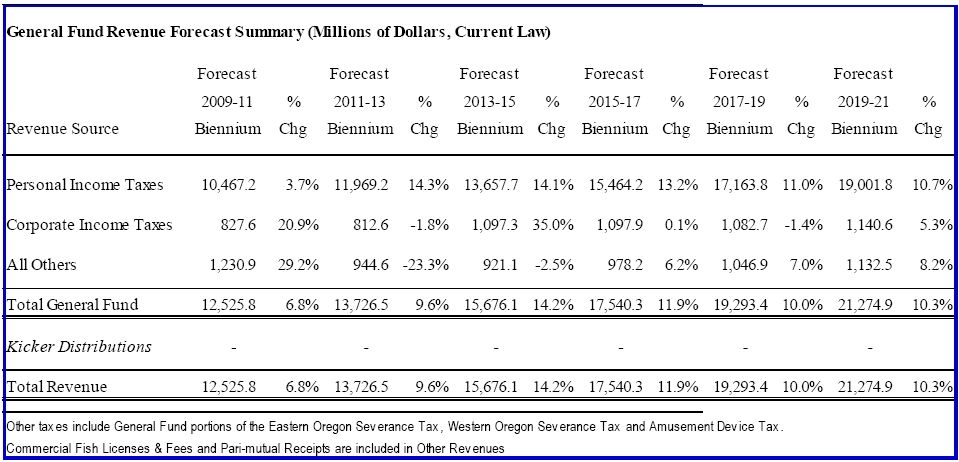 |
General Fund revenues will total $15,676 million in 2013-15, an increase of 14.2% percent from the prior period, and $9 million (0.1%) above the December forecast. In 2015-17, revenue growth will moderate to 11.9%, followed by slower rates of around 10% in subsequent biennia. The slowdown in long-run revenue growth is largely due to the impact of demographic changes. Revenues in 2015-17 and beyond are expected to be smaller than in the December forecast, largely due to a downgraded outlook for retirement income. An unexpectedly large amount of assets have been pulled from retirement accounts in recent years, leading to smaller nest eggs. Table B.2 in Appendix presents a more detailed look at the long-term General Fund revenue forecast.
(Note from editor: this document contains several interesting graphs and illustrations, continue viewing this document here.
|
 |
 |
 |
 |
Articles for February 7, 2012 | Articles for February 8, 2012 | Articles for February 9, 2012
Quick Links
DINING
Willamette UniversityGoudy Commons Cafe
Dine on the Queen
Willamette Queen Sternwheeler
MUST SEE SALEM
Oregon Capitol ToursCapitol History Gateway
Willamette River Ride
Willamette Queen Sternwheeler
Historic Home Tours:
Deepwood Museum
The Bush House
Gaiety Hollow Garden
AUCTIONS - APPRAISALS
Auction Masters & AppraisalsCONSTRUCTION SERVICES
Roofing and ContractingSheridan, Ore.
ONLINE SHOPPING
Special Occasion DressesAdvertise with Salem-News
Contact:AdSales@Salem-News.com


Salem-News.com:
Terms of Service | Privacy Policy
All comments and messages are approved by people and self promotional links or unacceptable comments are denied.
stephen February 9, 2012 11:36 am (Pacific time)
2 + 2 = 9 This is much easier than all the fake numbers, they should just come out and say it. For them? 2 + 2 = whatever number suits them.
[Return to Top]©2026 Salem-News.com. All opinions expressed in this article are those of the author and do not necessarily reflect those of Salem-News.com.